Barley Genetics Newsletter
37:5-20 (2007)
Frequency distributions and composite interval mapping
for QTL analysis in ‘Steptoe’ x ‘Morex’ barley mapping population
H. S. Rao1, 2†, O. P. Basha1, N. K. Singh1, K. Sato3, H. S. Dhaliwal1*
Indian Institute of Technology
Roorkee, UA,
1Department of Biotechnology, Indian Institute of Technology Roorkee,
Roorkee 247667,
2Present address: 101, Maize Genetics Unit, Division of Genetics, LBS Building,
Indian Agricultural Research Institute,
3Barley
*corresponding author Email: hsdhafbs@iitr.ernet.in
FAX: 91-1332-273560 Tel.: 01332-285259
†Additional author Email: hsr_f12@rediffmail.com
ABSTRACT
With the advancement of QTL
mapping strategies, the traditional approaches for the identification of genes
and their effects responsible for trait expression are gradually losing
significance. The phenotypic data for heading days, plant height, peduncle
length, number of tillers and stripe rust was recorded on 150 recombinant
inbred line (RIL) population developed from a barley cross of ‘Steptoe’ and
‘Morex’. Preliminary examinations of frequency distribution plots were fairly
useful in the prediction of number of genes governing traits expression in
barley (Hordeum vulgare L.).
The predictions were then systematically confirmed through QTL mapping.
Molecular marker data for the population available at the public domain
(GrainGenes website) was used for the construction of linkage map and QTL
analysis. Clear colinearity was observed between the number of QTLs identified
and the number of genes predicted based upon frequency distribution study
alone. A total of 17 QTLs were detected for the five traits evaluated. Several
major QTLs were detected on chromosome 2H, which could serve as candidate for map-based studies of phenomena such as
pleiotropism, recombination hot spots, gene-rich regions and QTL clustering.
Keywords. Barley, frequency distribution, quantitative trait loci, recombinant inbred line, peduncle length, stripe rust, gene rich region.
INTRODUCTION
Cultivated barley (Hordeum vulgare L.) is a diploid (2n=14) which ranks fourth among the most important cereal crops in the world after rice, wheat and maize. Barley belongs to the same tribe Triticeae as that of wheat and rye and it resembles wheat in many respects. Barley is however, more tolerant to soil salinity and drought than wheat. Many important traits of economic and agronomic importance in barley are quantitative in nature displaying continuous variation. The efficiency of breeding programs depends on our knowledge of the genetic control and genomic location of QTLs governing the trait(s) of interest. With the advent of molecular markers (Botstein et al. 1980) and the user-friendly statistical software it has become possible to resolve and map the QTLs for complex traits on chromosomes.
QTL analysis in barley is significant not only for the crop itself but also for comparative mapping with other cereal crops. The identification of diverse taxa sharing segments of similar gene orders throughout their genomes has been the major outcome of comparative mapping where chromosome alignment has hastened identification of new genes for their ultimate introgression into suitable cultivars. The genetic maps of diploid wheat, Triticum monococcum and barley, Hordeum vulgare L. are remarkably conserved except for few regions where translocation and inversion of chromosome segments have taken place (Dubcovsky et al. 1996). There is also a high level of genomic conservation at specific regions with rice, maize and oat (Deynze et al. 1995, Han et al. 1998).
The results of several QTL mapping studies have indicated that there are only few major genes, which interact with numerous minor genes and environment to give continuous trait phenotype characteristic of quantitative traits. Thus examination of frequency distribution plots at single location is useful in assessing the probable number of major genes controlling a trait. This is particularly useful when resources are limiting and a decision has to be taken on priority basis before starting a breeding program for which trait QTL mapping experiment should be undertaken. The present article deals with the mapping of QTLs for a number of traits in a barley ‘Steptoe’ x ‘Morex’ RIL mapping population and its relationship with the predictive value of frequency distribution for the traits.
MATERIALS AND METHODS
Plant Material
150
recombinant inbred lines (RILs) derived from a cross between two barley (Hordeum vulgare L.) genotypes
‘Steptoe’ and ‘Morex’, obtained from Dr. Kazuhiro Sato,
Phenotypic Data
The data on five quantitative traits were recorded as the average of five competitive plants per RIL. The number of days to heading was recorded as the number of days from sowing till half of the tillers in a RIL had flowered. Plant height (cm) was recorded as the length of plant from the base at the soil surface to the tip of spike of the tallest tiller excluding awns. Peduncle length was measured as the length of peduncle from the base of flag leaf to the base of basal spikelet of a spike. The number of effective tillers bearing spikes was taken as the number of tillers per plant. The data on natural incidence of stripe rust at the adult plant stage under field conditions was recorded as percent severity of the leaf area covered by stripes of uredia and the type of pustules, where the symbol S for susceptible was used for large pustules without any necrotic area; MS, MR for moderately susceptible/resistance for small pustules with or without necrotic areas around them and R for hypersensitive immune reaction without any pustule.
Data Analysis
The basic statistical analysis was performed for all the traits recorded. Mean, range and standard deviations were estimated. Correlation coefficient among various traits was calculated to infer probable inter-relationships between the traits studied. Frequency distribution plots for traits were presented as about ten phenotypic classes in the RIL population.
Genotypic data and Linkage mapping
Genotypic data for 343 molecular markers available at the public domain (GrainGenes website: http://www.gene.pbi.nrc.ca) for 150 RILs of ‘Steptoe’ x ‘Morex’ mapping population was utilized for the construction of linkage map. Standard c2 test was used to test the segregation pattern of each marker. Linkage map was constructed by using the software package MAPMAKER/EXP version 3.0 (Lincoln et al. 1992). A LOD score of 3.0 and a maximum recombination frequency of 0.40 were used to declare linkage between two markers.
QTL mapping
QTL analysis was performed using the method of Composite Interval Mapping (CIM) (Zeng 1994) as in QTL Cartographer version 2.5 (Wang et al. 2005). Composite interval mapping combines the approaches of interval mapping (IM) and Single Marker Analysis in a multiple regression framework. Initially it builds cofactors by selecting most significant markers through Single Marker Analysis methodology. Once the model containing cofactors is built, the entire genome is rescanned using interval mapping. We used model 6 with window size 10 cM where forward and backward regression method was utilized. Walk speed was set at 2 cM to scan the entire genome. We performed 1000 permutations at 0.05 significance level to balance type 1 and type 2 errors and declare appropriate threshold levels for QTL (Churchill and Doerge 1994). The best estimate of QTL location was assumed to correspond to the position having the peak significance level and the confidence interval was drawn according to 1-LOD support interval (Lander and Botstein 1989).
RESULTS
Frequency distribution for various traits
The frequency distributions for the five traits evaluated are given in Figure 1. Only plant height showed normal distribution while all other traits displayed various levels of skewedness. The days to heading trait was roughly partitioned into two phenotypic classes, one with early heading habit while the other showing late heading trait. Peduncle length also showed two phenotypic classes but the distribution tended to be strongly influenced by embedded peduncle genotype rather than emerged peduncle. Tiller numbers showed broad range with transgressive segregation towards both ends. The histogram for stripe rust showed continuous disease distribution pattern and the phenotypic classes were clearly partitioned into five clusters.
Phenotypic data Analysis
Except for the heading days all traits showed transgressive segregation and their phenotypic values exceeded beyond both of the mean parental values (Table 1). The correlation coefficients between most of the trait combinations were found to be significant ( Table 2). As expected peduncle length had extraordinarily high correlation with heading days and plant height. Peduncle length and heading habit were negatively correlated, i.e. the emerged peduncle inbred lines had more probability of early heading habit whereas the embedded peduncle lines had late heading. The significant positive correlation between plant height and peduncle extrusion could explain the fact that in taller plants, peduncle grew faster to emerge out of the boot leaf before anthesis.
TABLE 1. Trait means in parent and trait means, standard
deviations (SD) and range in RILs of
Steptoe
x Morex population
|
|
Parents |
RIL population |
||
|
Trait |
Steptoe |
Morex |
Range |
Mean ± SD |
|
Heading days |
126.0 |
100.0 |
101.0 – 126.0 |
112.05 ± 7.35 |
|
Plant height (cm) |
66.4 |
100.1 |
61.0 – 126.6 |
95.57 ± 13.27 |
|
Peduncle length (cm) |
5.7 |
24.2 |
0 – 28.6 |
10.21 ± 6.61 |
|
Tiller number |
2.6 |
3.1 |
1.2 – 6.4 |
3.49 ± 1.08 |
|
Stripe rust (%) |
12.5 |
75 |
0 – 100 |
43.11 ± 22.83 |
TABLE 2. Correlation coefficient (r) among various traits in RIL population
|
|
Plant height |
Peduncle length |
Tiller number |
Stripe rust |
|
Heading days |
-0.5491* |
-0.7392* |
-0.4987* |
-0.2056 |
|
Plant height |
|
0.6360* |
0.5112* |
0.1595 |
|
Panicle exertion |
|
|
0.3880* |
0.1334 |
|
Tiller number |
|
|
|
0.2111 |
* P < 0.0001
Linkage map
Out of the 434 polymorphic molecular markers data available at GrainGenes website, we selected 343 by rejecting markers with more than 40% missing genotypes and those showing segregation distortion at 0.05 significance level (χ2 =3.841). Except for the two regions in chromosomes 5 (1H) and 6 (6H), the whole genome was adequately covered with markers and the centromeres were placed on consensus positions based on marker orders along the chromosomes. The order of markers and centromere positions did not vary much from their established map positions. The combined length of the linkage map was 824.1 cM with average spacing of 2.40 cM between adjacent markers.
Genomic distribution of QTLs
QTLs
detected by CIM analysis as implemented in QTL Cartographer version 2.5 are
presented in Table 3. The parent contributing respective alleles for increasing
trait value for heading days (HD), plant height (PH), peduncle length (PL),
number of tillers (TN) and the allele conferring resistance to stripe rust (SR)
were indicated in the table. In the present study, five QTLs were identified for heading days exceeding the
threshold LOD score. ‘Morex’ parent contributed early heading alleles for all
the QTLs identified. Most of the phenotypic variance was explained by the QTLs
on 2H and 1H while those on 7H and 3H had only a minor effect. Identification
of several plant height QTLs spread throughout genome (7H, 2H, 2H, 3H, 6H, 6H
and 5H) supported the results of frequency distribution. The two QTLs on 2H and
3H together explained about 40% of the phenotypic variance. The alleles
responsible for increase or decrease in height had come from both of the
parents and thus supporting transgressive segregation observed for some of the
RILs. Two major QTLs, one each on chromosomes 2H and 3H were identified for
peduncle length while a third putative QTL detected on 1H had only a minor
effect. Only one QTL was identified for tillering ability on chromosome 2H. For
stripe rust, although four resistance QTLs spread across chromosomes 2H, 3H, 4H
and 5H were identified, none of them explained significant phenotypic variance.
TABLE 3. Chromosome mapping of various QTLs with nearest
linked molecular marker for different traits
|
Trait |
Chromosome |
Marker interval |
Position (cM) |
LOD |
Additive |
R2 x 100 |
Allele |
|
Heading date |
1 (7H) |
ABC156d - ABG022A |
41.61 |
4.35 |
1.8964 |
6.60 |
S |
|
2 (2H) |
ABG005 - Pox |
33.41 |
18.78 |
4.1443 |
31.42 |
S |
|
|
2 (2H) |
Adh8 – CDO537 |
47.00 |
6.39 |
2.47 |
8.00 |
S |
|
|
3 (3H) |
ABG471 - ABG399 |
38.11 |
3.22 |
1.6616 |
4.96 |
S |
|
|
5 (1H) |
ABC307A-cMWG706A |
31.31 |
11.69 |
3.2381 |
19.35 |
S |
|
|
Plant height |
1 (7H) |
Pgk2B - PSR129 |
67.91 |
2.49 |
2.8861 |
4.72 |
S |
|
2 (2H) |
ABG005 - Pox |
33.41 |
8.83 |
-5.7128 |
18.43 |
M |
|
|
2 (2H) |
Adh8 - CDO537 |
43.31 |
8.41 |
-6.1379 |
20.57 |
M |
|
|
3 (3H) |
ABC156c - AtpbB |
46.81 |
12.37 |
-5.7998 |
18.77 |
M |
|
|
6 (6H) |
CDO497 - ABR335 |
40.91 |
3.07 |
3.2705 |
6.00 |
S |
|
|
6 (6H) |
BCD340E - ksuD17 |
45.91 |
3.74 |
3.5796 |
7.24 |
S |
|
|
7 (5H) |
ABG708 - Dor5 |
30.31 |
4.93 |
-4.2142 |
9.72 |
M |
|
|
Peduncle length |
2 (2H) |
ABG358 - ABG459 |
28.71 |
19.30 |
-3.9943 |
36.24 |
M |
|
3 (3H) |
ABG471 - ABG399 |
38.11 |
4.63 |
-2.6111 |
15.38 |
M |
|
|
5 (1H) |
ABC307A |
92.31 |
2.61 |
-1.7200 |
6.76 |
M |
|
|
Tiller # |
2 (2H) |
MWG858 - ABG358 |
28.61 |
4.89 |
-0.3615 |
11.02 |
M |
|
Stripe rust
resistance |
2 (2H) |
MWG858 - ABG358 |
26.61 |
2.95 |
-4.9528 |
6.22 |
S |
|
3 (3H) |
ABG377 - MWG555b |
61.31 |
5.10 |
7.0202 |
11.30 |
M |
|
|
4 (4H) |
ABC321 - ABR315 |
30.21 |
3.24 |
-5.1908 |
6.88 |
S |
|
|
7 (5H) |
ABG391 |
124.81 |
2.64 |
-4.6547 |
5.56 |
S |
DISCUSSIONS
Frequency distribution of
various traits
RILs are inbred lines derived from a
cross of two diverse parents in which the individual genes are resolved into
homozygous progenies. If we construct a histogram on such a population, the
number and size of phenotypic classes obtained is directly related to the
number of genes influencing the trait. For example, if a single gene controls
the trait, there will be two phenotypic classes of equal sizes and if two genes
control the trait there will be three phenotypic classes in 1:2:1 size
proportion. If we assume the genes are additive and explaining equal variance,
their should be n + 1 number of phenotypic classes observed for n number of
genes in the population for as many number of additive gene combinations. On
the other hand if epistatic interactions were significant and the individual
genes were contributing unequally towards the overall phenotype, the
distribution of phenotypic classes becomes skewed. From the preliminary
observation of histograms (Figure 1) the approximate number of genes
responsible for each trait could be predicted.
For example, there should be one gene explaining most of the phenotypic
variance for heading days as we observed two broad phenotypic classes in the
histogram. There should also be one more gene with lesser but significant
effect, which is responsible for minor third phenotypic class in between the
two major classes. Height is the perfect example of quantitative inheritance
where we expect large number of alleles acting additively to give normal
distribution. The presence of two phenotypic classes is the indicative of
single gene inheritance for peduncle length, but their unequal proportion could
be explained by presence of one more parallel allele contributing towards short
peduncle length phenotype. Tillering trait showed normal distribution and large
transgressive segregation beyond both parental types. Thus, in barley we do not
expect tiller number to be governed by single gene. Although we observed only
one QTL exceeding the threshold LOD score, there is an indication of two more
putative QTLs on chromosomes 7H and 1H (Figure 3). Also, some of the QTLs on
chromosomes 3H and 6H identified by Franckowiak and Lundqvist, 2002,
Buck-Sorlin, 2002 and Babb and Muehlbauer, 2003, remained undetected in the
present study. The most probable explanation could be that ‘Steptoe’ and ‘M’
are not diverse enough with respect to tillering ability and it actually
limited the QTL mapping approach to detect all genes of the trait. Frequency
distribution of stripe rust has shown overall normal disease distribution
pattern clustered in three major segregative and two minor transgressive
groups. Both parents were susceptible to stripe rust but the rust progressed
slowly in ‘Steptoe’ with very low terminal severity, usually called slow
rusting. The five classes for rust severity could be explained by the presence
of four genes, each of which was contributing additively towards resistance to
stripe rust. When the resistance alleles for all four genes were present in a
single genotype (4R), maximum resistance is expected which was observed with
zero percent rust severity in the first transgressive group. Similarly,
genotypes with 3R+1S, 2R+2S, 1R+3S and 4S allele combinations explained second,
third, fourth and fifth groups, respectively in the frequency distribution
plot.
QTL Analysis
Heading Days: Days to Flower or heading days is
considered to be an important trait for planning of a breeding program.
Early-heading genotypes are preferred when the objective is to grow a cultivar
late or early in the growing season. Heading time in barley and wheat is
governed by three major genetic systems: vernalization requirement (response to
low temperature at the initial stages of plant development), photoperiod
sensitivity (day length) and narrow-sense earliness (response to sum of
temperature over a long period). Vernalization is the requirement of low
temperature period to plants for transition from a vegetative to a reproductive
phase. Among the vrn loci, Vrn1 on the group 5
chromosomes of Triticeae (A, B, D and H genomes) are the most extensively
characterized in terms of its effects and inheritance (Law et al. 1976, Galiba
et al. 1993, Kato et al. 1999). The vernalization responsive phenotype is often
found in conjunction with photoperiod sensitivity, a delay in flowering when
plants are grown under short-day conditions (Karsai et al. 2001). Low
vernalization requirement of barley was probably met with partially but longer
photoperiod could be available only in the last week of March and hence delayed
flowering in RILs with Ppd.
The Ppd – H1 photosensitivity locus was first described by Laurie
et al. (1994) on the short arm of chromosome 2H. In barley, eps
2S, located near the centromere region of the 2H chromosome has been reported
to be a QTL for the environment independent narrow-sense earliness (Laurie et
al. 1995). The RILs in the present investigation were sown without
vernalization treatment. The QTL analysis carried out without partitioning of
heading trait into three categories identified two significant QTL on 2H which
probably represent Ppd and eps loci. Thus major effect on
heading days under field conditions was due to the photoperiod and environment
independent narrow sense earliness genes. Major role of 2H in determining
heading days in barley is also inferred from the investigations carried out by
Marquez-Cedillo et al. (2001), Kicherer et al. (2000), Karsai et al. (2005) and
Qi et al. (1998) who detected heading days QTL on chromosomes 2H; 2H; 2H, 4H,
5H; and 2H, 7H, respectively.
Plant Height: Before the green revolution, one of the major causes of yield loss was lodging of tall cultivars during rain and strong winds. Plant height and culm stiffness are reported to be the two most important traits determining lodging resistance in cereal plants (Keller et al. 1999). Murthy and Rao (1980) and Stanca et al. (1979) have worked out significant correlation between lodging resistance and dwarfness in barley. Recently Chloupek et al. (2006) demonstrated the significance of different sets of semi-dwarf genes in the determination of different root system size that was further implicated with biotic and abiotic stresses. With the development of semi-dwarf varieties, yield loss was largely overcome and the plant utilized its resources in increasing harvest index rather than its biomass. If the objective of the breeding program is to enhance the grain production as in most instances, the breeder prefers dwarf variety but if the objective is to utilize the plant for dual purpose for fodder as well, then the breeder obviously goes with taller varieties. Several studies in the recent past had identified QTL for plant height in barley distributed throughout genome but the major QTLs identified in the present study on chromosome 2H and 3H were found to occur more often than others. For example, Thomas et al. (1995) detected plant height QTLs on 1H, 3H and 7H; Marquez-Cedillo et al. (2001) on 2H, 3H, 4H and 5H; Kicherer et al. (2000) identified on 2H and 3H; Qi et al. (1998) on 2H, 3H and 7H; Teulat et al. (2001) on 2H, 3H, 4H, 5H, 6H and 7H; Zhu et al. (1999) on 1H, 3H, 4H and 6H; and Chloupek et al. (2006) on 3H, 4H, 5H and 7H.
Peduncle length: Peduncle length is an important character in barley as the inability of spikes to emerge out of boot leaf not only eliminates outcrossing but also adversely affects the use of its photosynthetic contribution to seed-setting and seed development. From the preliminary observation on correlation coefficient, we can predict that heading date and plant height jointly influences the ability of peduncle to emerge out since early heading and tall plants had emerged peduncle. We can infer that photoperiod (2H) had major effect on peduncle length while narrow sense earliness (2H and 1H) had relatively minor effect on peduncle length. Chromosome 3H also had significant influence on the trait which might be coming from major plant height QTL on the same chromosome. Hence, we can conclude that peduncle length is a composite trait whose component traits include heading days and plant height.
Number of Tillers: Tiller number is regarded as an important yield component in wheat, barley and rice as the number of effective tillers is equal to the number of spikes. The plants with lesser tiller number generally have long spikes with increased grain weight and overall sturdy plant architecture (Vasu at al. 2006). But the advantage of high tiller numbered plant is that the overall harvest index from single plant is much higher and it saves the unit area of land required to grow plants for similar yields. In the present study, the tillering ability of plants behaved as a single gene inherited trait and only one QTL on chromosome 2H could be detected. Although earlier studies have also indicated single gene inheritance pattern for the trait, chromosomal locations of QTLs were not consistent with the present study. Franckowiak and Lundqvist, 2002, Buck-Sorlin 2002 and Babb and Muehlbauer 2003 have identified major QTL lnt1 on chromosome 3HL and a second QTL cul2 on 6HL.
Stripe Rust: Stripe rust is a major disease in Triticeae and its causal organism in barley is a biotrophic fungus, Puccinia striiformis f. sp. hordei. The characteristic feature of the disease is the appearance of pale stripes on leaves followed by emergence of orange brown uredosori that contain fungal spores. Yield loss of upto 30 % may occur, as photosynthetic and metabolic capabilities of the plant are severely impaired. Rust resistance in Triticeae is mainly of two types viz., vertical and horizontal. Vertical resistance is race-specific conditioned by gene-for-gene interaction between host and pathogen (Flor 1946). Horizontal resistance, on the other hand is race-non-specific governed by multiple genes with small effects. The results of the present analysis show that the resistance QTLs identified were acting in a race non-specific manner where they prevent pathogen(s) to form a basic compatibility reaction. The ‘Steptoe’ is a slow stripe rusting genotype. The rust infection is of susceptible type but the disease progresses very slowly without causing an appreciable loss. Some of the QTLs for resistance mapped in the present study were colinear with the previously mapped QTL using different barley populations on chromosomes 4H, 5H (Chen et al. 1994); 2H, 3H, 1H, 6H (Toojinda et al. 2000); 1H, 2H, 4H, 6H, 7H (Berloo et al. 2001); 2H, 4H (Kicherer et al. 2000); and on 3H, 4H, 7H (Toojinda et al. 1998) using local rust pathotypes further confirming their race-non-specific resistance. The QTLs with their low individual phenotypic variances when pyramided in a single genotype could confer high overall resistance. The approach for pyramiding of resistance QTLs was well demonstrated for 1H, 4H and 7H conferring resistance to stripe rust at seedling stage in barley by Castro et al., (2003).
QTL clusters
Although the large genome size (4.9 × 10⁹ bp) of barley makes the genetic manipulations difficult, some of the recent advances in comparative genomics have suggested the presence of recombination hot spots and gene-rich regions in Triticeae where targeted approaches could be utilized for genome analysis (Gill et al. 1996). Identification of multiple QTLs on chromosomes 2H and 3H were also indicative of gene-rich regions in barley. 2H is especially important because it contained QTLs for all of the traits analyzed in the present study. Aissani and Bernardi (1991) suggested the distribution of less conserved genes in euchromatic regions while the distribution of conserved genes in the heterochromatin region. This could be of evolutionary significance as the genes in euchromatin region exposed to manipulations were providing diversity for the plants to adjust to different environmental conditions while the genes of heterochromatin region might be regulatory in function, which must be conserved for their essential role in the very existence of the organism.
Although the QTL analysis is of tremendous use in the identification of genomic regions pertaining to the traits of economic importance, it fails to identify the complete set of genes of a biochemical pathway leading to the expression of trait. Many of the conserved genes for which there are no allelic variants cannot be detected by this approach. Such genes have been conserved through evolutionary forces and any attempt to change them could have deleterious effect on the survival ability of the organism.
CONCLUSION
It has been shown here that QTL mapping is an accurate approach for the identification of genes underlying a trait but it is also cost intensive to carry out such exercise for all traits. On the other hand, construction of frequency distribution plots in routinely developed mapping populations could be used as diagnostic assessment for the prediction of number and effects of genes before planning QTL mapping experiment. Although such an approach is very crude, it would be useful in making appropriate allocation of resources.
In the present study, it has been found that proximal region of chromosome 2H is of special interest as it contains QTLs for all of the traits studied explaining large phenotypic variances and thus the region could serve as candidates for further investigation. Significant correlation among various traits was because of QTL linked in coupling phase and in some of the instances pleiotropism cannot be ruled out. The other genomic regions of interest include chromosome 3(3H) and chromosome 5(1H), which harbors QTL for heading, peduncle length and plant height. Further study needs to be carried out to fine map and ultimately dissect out the individual genes in the region. Map-based cloning is gradually becoming a feasible approach for dissection of the QTL genes in Triticeae (Li et al. 2003). The individual QTL effects could be studied efficiently by generating near isogenic lines (NILs) in an organized backcross program, which specifically nullifies the background noise. In the recent past bioinformatics tools have gained significant importance to aid in silico comparative genomic studies in species with large unmanipulable genomes like barley and wheat with the help of well studied genomes such as Arabidopsis thaliana, rice and maize.
ACKNOWLEDGEMENT
The authors extend thanks to Dr.
Firoz Hossain, Indian Agricultural Research Institute,
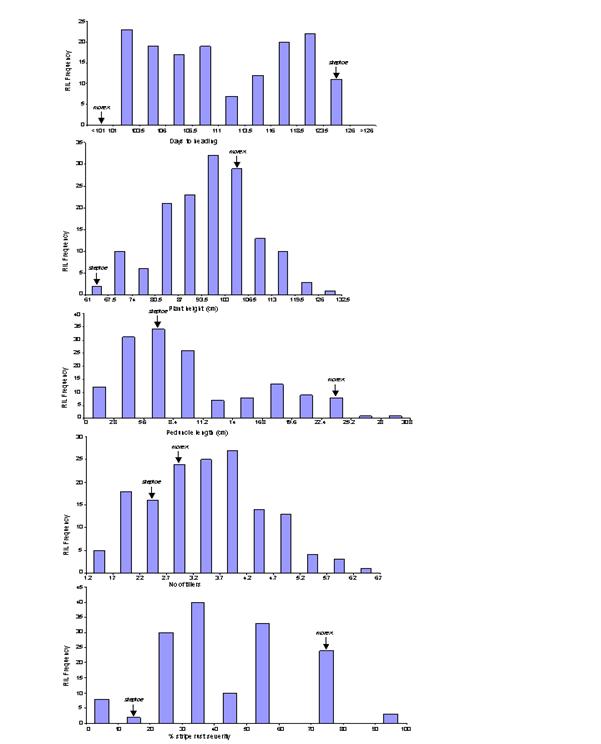
Figure 1. Frequency distribution plots for heading days (HD), plant height (PH), peduncle length (PL), tiller number (TN), and stripe rust (SR) in RILs of Steptoe x M population.
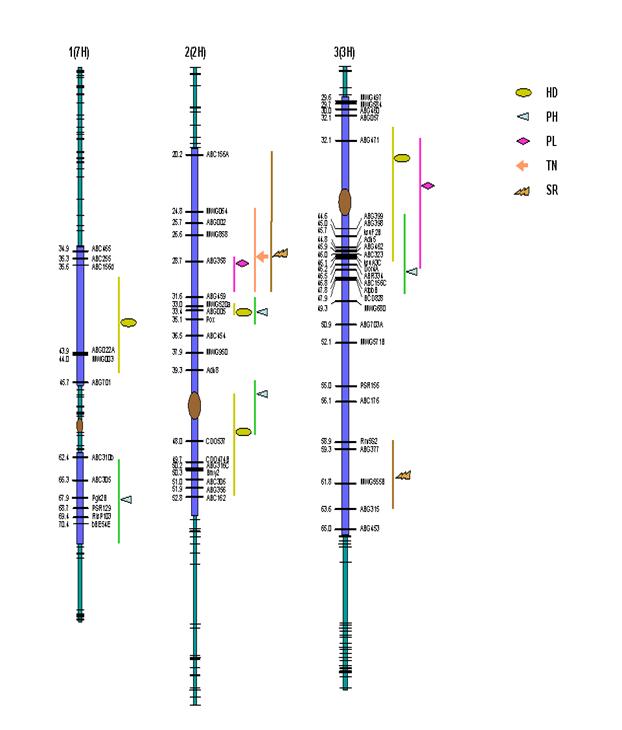
Figure
2. Genetic map of SM barley RIL population with 343 molecular markers
indicating QTLs for heading days (HD), plant height (PH), peduncle length (PL),
number of tillers (TN) and stripe rust (SR). Vertical bar and the symbols
represent confidence interval and peak LOD scores respectively for various QTLs
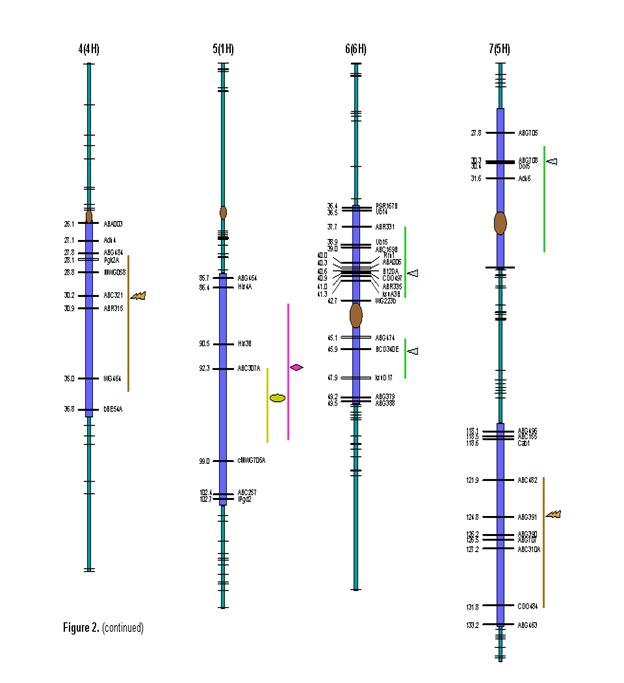
Figure 2. (continued) Genetic map of SM barley RIL population with 343 molecular markers indicating QTLs for heading days (HD), plant height (PH), peduncle length (PL), number of tillers (TN) and stripe rust (SR). Vertical bar and the symbols represent confidence interval and peak LOD scores respectively for various QTLs.
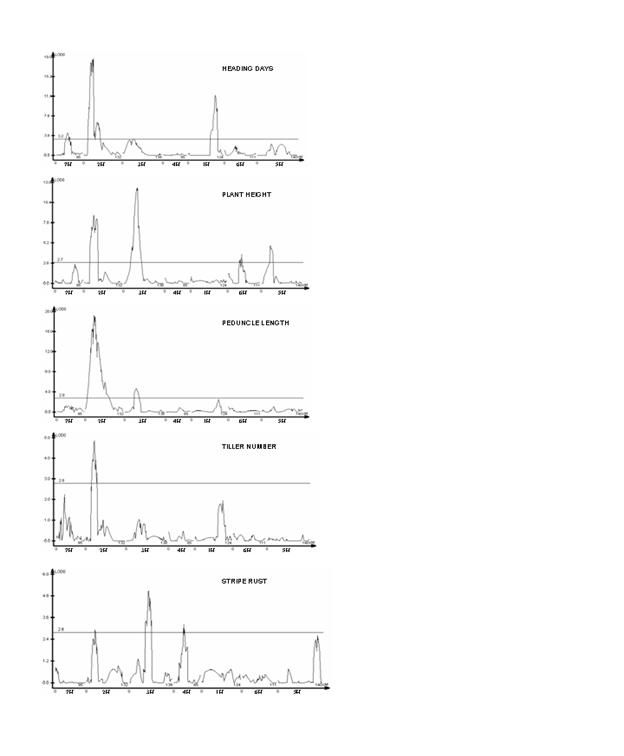
Figure
3. QTL likelihood maps for various traits obtained from composite interval
mapping (CIM) analysis indicating LOD score along the ordinate while genetic
map (all chromosomes together) along the abscissa. The respective threshold LOD
estimated by 1000 permutations at 0.05 significance, are represented as
horizontal line.
FIGURE 2 FIGURE 2 Continued
REFERENCES
Aissani, B., and G. Bernardi, 1991: CpG islands: features and distribution in the genomes of vertebrates. Gene 106, 173-183
Babb, S., G. J. Muehlbauer, 2003: Genetic and morphological characterization of the barley uniculm2 (cul2) mutant. Theor. Appl. Genet. 106, 846–857
Botstein, D., R. L. White, M. Skolnick, and R. W. Davis, 1980: Construction of genetic linkage map in man using restriction fragment length polymorphisms. Am. J. Hum. Genet. 32, 314-331
Buck-Sorlin, G. H. 2002: The search for QTL in barley (Hordeum vulgare L.) using a new mapping population. Cell Mol. Biol. Lett. 7, 523–535
Castro, A. J., X. Chen, P. M. Hayes, and M. Johnston, 2003: Pyramiding Quantitative Trait Locus (QTL) Alleles Determining Resistance to Barley Stripe Rust: Effects on Resistance at the Seedling Stage. Crop Sci. 43, 651–659
Chen, F. Q., D. Prehn, P. M. Hayes, D. Mulroney, A. Corey and H. E. Vivar, 1994: Mapping genes for resistance to barley stripe rust (Puccinia striiformis f. sp. hordei). Theor. Appl. Genet. 88, 215–219
Chloupek, O., B. P. Forster, and W. T. B. Thomas, 2006: The effect of semi-dwarf genes on root system size in field-grown barley. Theor. Appl. Genet. 112, 779–786
Churchill, G. A., and R. W. Doerge, 1994: Empirical threshold values for quantitative trait mapping. Genetics 138, 963-971
Deynze, A. E. V., J. C. Nelson, E. S. Yglesias, S. E. Harrington, D. P. Braga, S. R. McCouch, and M. E. Sorrells, 1995: Comparative mapping in grasses. Wheat relationships. Mol. Genet. Genomics 248, 744-754
Dubcovsky, J., Ming-Cheng Luo, Gan-Yuan Zhong, R. Bransteitter, A. Desai, A. Kilian, A. Kleinhofs, and J. Dvorak, 1996: Genetic map of diploid wheat, Triticum monocuccum L. and its comparison with maps of Hordeum vulgare L. Genetics 143, 983-999
Flor, H.H., 1946: Genetics of pathogenicity in Melampsora lini. J. Agric. Res. 73, 335–357
Franckowiak,
J. D., and U. Lundqvist, 2002: Current List of New and Revised Barley Genetic
Stock Descriptions. Barley Genet. Newsl. 32,
47
Galiba, G., S. A. Quarrie, J. Sutka, A. Morgounov, and J. W. Snape, 1995: RFLP mapping of vernalization (Vrn1) and frost resistance (Fr1) genes on chromosome 5A of wheat. Theor. Appl. Genet. 90, 1174-1179
Gill, K. S., B. S. Gill, T. R. Endo, E. V. Boyko, 1996: Identification and high-density mapping of gene-rich regions in chromosome group 5 of wheat. Genetics 143, 1001-1012
Han, F., A. Kleinhofs, S. E. Ullrich, A. Kilian, M. Yano, and T. Sasaki, 1998: Synteny with rice: Analysis of barley malting quality QTL and rpg4 chromosome regions. Genome 41, 373–380
Karsai,
Karsai,
Kato, K,, H. Miura, and S. Sawada, 1999: QTL mapping of genes controlling ear emergence time and plant height on chromosome 5A of wheat. Theor. Appl. Genet. 98, 472-477
Keller, M., Ch. Karutz, J. E. Schmid, P. Stamp, M. Winzeler, B. Keller, and M. M. Messmer, 1999: Quantitative trait loci for lodging resistance in a segregating wheat x spelt population. Theor. Appl. Genet. 98, 1171-1182
Kicherer, S., G. Backes, U. Walther, and A. Jahoor, 2000: Localising QTLs for leaf rust resistance and agronomic traits in barley (Hordeum vulgare L.). Theor. Appl. Genet. 100, 881-888
Lander, E. S., and D. Botstein, 1989: Mapping Mendelian factors underlying Quantitative traits using RFLP linkage maps. Genetics 121, 185-199
Laurie, D. A., N. Pratchett, J. H. Bezant, and J. W. Snape, 1994: Genetic analysis of a photoperiod response gene on the short arm of chromosome 2 (2H) of Hordeum vulgare (barley). Heredity 72, 619-627
Laurie, D. A., N. Pratchett, J. H. Bezant, and J. W. Snape, 1995: RFLP mapping of five major genes and eight quantitative trait loci controlling flowering time in winter x spring barley (Hordeum vulgare L.) cross. Genome 38, 575-585
Law, C. N., A. J. Worland, B. Giorgi, 1976: The genetic control of ear-emergence time by chromosomes 5A and 5D of wheat. Heredity 36, 49-58
Li, H., S. A. Brooks, W. Li, J. P. Fellers, H. N. Trick, and B. S. Gill, 2003: Map-based cloning of leaf rust resistance gene Lr21 from the large and polyploid genome of bread wheat. Genetics 164, 655-664
Lincoln, S. E., M. Daly, and E. S. Lander, 1992: Constructing
genetic maps with MAPMAKER/EXP 3.0. Whitehead Institute technical report, 3rd
edn.
Marquez-Cedillo, L. A., P. M. Hayes, A. Kleinhofs, W. G. Legge, B. G. Rossnagel, K. Sato, S. E. Ullrich, and D. M. Wesenberg, The North American Barley Genome Mapping Project, 2001: QTL analysis of agronomic traits in barley based on the doubled haploid progeny of two elite North American varieties representing different germplasm groups. Theor. Appl. Genet. 103, 625-637
Murthy, B. N., and M. V. Rao, 1980: Evolving suitable index for lodging resistance in barley. Indian J. Genet. Plant. Breed. 40, 253-261
Qi, X., R. E. Niks, P. Stam, and P. Lindhout, 1998: Identification of QTLs for partial resistance to leaf rust ( Puccinia hordei) in barley. Theor. Appl. Genet. 96, 1205–1215
Stanca, A. M., G. Jenkins, and P. R. Hanson, 1979: Varietal responses in spring barley to natural and artificial lodging and to a growth regulator. J. Agric. Sci. Camb. 93, 449-456
Teulat, B., O. Merah,
Thomas, W. T. B., W. Powell, R. Waugh, K. J. Chalmers, U. M. Barua, P. Jack, V. Lea, B. P. Forster, J. S. Swanston, R. P. Ellis, P. R. Hanson, and R. C. M. Lance, 1995: Detection of quantitative trait loci for agronomic, yield, grain and disease characters in spring barley (Hordeum vulgare L.). Theor. Appl. Genet. 91, 1037-1047
Toojinda, T., E. Baird, A. Booth, L. Broers, P. Hayes, W. Powell, W. Thomas, H. Vivar, and G. Young, 1998: Introgression of quantitative trait loci (QTLs) determining stripe rust resistance in barley: an example of marker-assisted line development. Theor. Appl. Genet. 96, 123–131
Toojinda, T., L. H. Broers, X. M. Chen, P. M. Hayes, A. Kleinhofs, J. Korte, D. Kudrna, H. Leung, R. F. Line, W. Powell, L. Ramsay, H. E. Vivar, and R. Waugh, 2000: Mapping quantitative and qualitative disease resistance genes in a doubled haploid population of barley (Hordeum vulgare). Theor. Appl. Genet. 101, 580–589
van Berloo, R., H. Aalbers, A. Werkman, and R. E. Niks, 2001: Resistance QTL confirmed through development of QTL-NILs for barley leaf rust resistance. Mol. Breed. 8, 187-195
Vasu K., S. Sood, H. S. Dhaliwal, P. Chhuneja, B. S. Gill, 2006: Identification and mapping of a tiller inhibition gene (tin3) in wheat. Theor. Appl. Genet. (Published online)
Wang, S., C. J. Basten, Z. B. Zeng, 2005: Windows QTL
Cartographer 2.5. Department of Statistics,
Zang, Z. B., 1994: Precision mapping of quantitative trait loci. Genetics 136, 1457-1468
Zhu, H., L. Gilchrist, P. Hayes, A. Kleinhofs, D. Kudrna, Z. Liu, L. Prom, B. Steffenson, T. Toojinda, and H. Vivar, 1999: Does function follow form? Principal QTLs for Fusarium head blight (FHB) resistance are coincident with QTLs for inflorescence traits and plant height in a doubled-haploid population of barley. Theor. Appl. Genet. 99, 1221–123